
One of the many useful features of Chrome Developer Tools (DevTools) is the blackbox preference. Normally when debugging code, if you step through code that references external source files (e.g., jQuery, Underscore.js, etc.), the debugger will step through that library code. Sometimes this may be good if you want to debug the library code, but most of the time, you trust the library code should be stable and you just want to focus on your code.
With the blackbox preference, DevTools can ignore or bypass any source files you choose during debugging. This means the debugger won't go into blackboxed files when stepping through code, and breakpoints in blackboxed files, if any, will also be ignored (i.e., the debugger will not pause at such breakpoints). This will save you time and minimize confusion in times where library code could generate a deep call stack.
How to blackbox
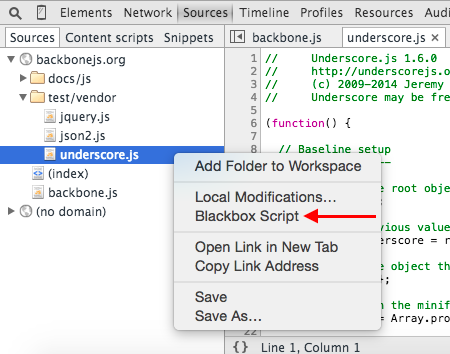
- In DevTools, navigate to the Sources panel
Right click the source file you want to blacklist in the navigator pane and select Blackbox Script
Manage blackboxed scripts
If you ever want to add, modify, or remove blackboxes, you can do so by going into the Settings.
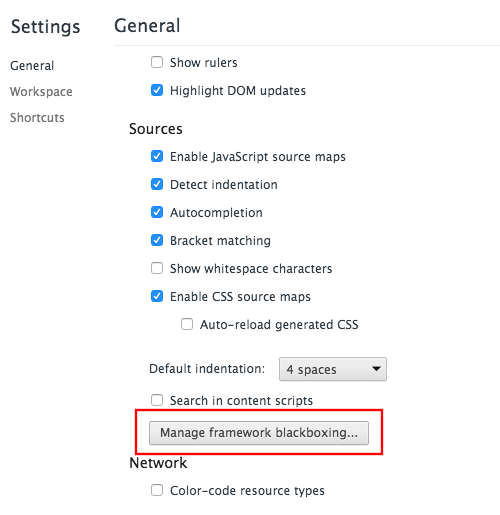
- In DevTools, navigate to the Settings panel
Under the Sources section, click Manage framework blackboxing
In the pop-up dialog, modify blackbox scripts as you wish
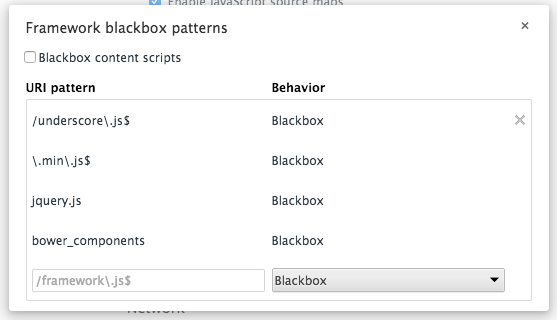
FYI, the URI pattern can accept the following values:
- The file name, e.g.,
jquery.jswould match any files with "jquery.js" in its name - A regular expression, e.g.,
\.min\.js$would match any files ending in "min.js" - A reference to an entire folder, e.g.,
bower_componentswould match all files within the "bower_components" folder
You can read more information about blackboxing from the Chrome Documentation.